
Most people receive their lab results as a list of numbers next to a reference range, with little explanation of what those numbers actually mean. As a biomedical scientist with published research in cellular biology, I wrote this guide to cover the tests that matter most, what they measure, and how to read them beyond the normal versus abnormal binary.
A Note on Reference Ranges

Reference ranges are population statistics, not health targets. A result within range means it falls in the middle 95% of a reference population. It does not mean it is optimal for you specifically.
Fasting glucose at 98 mg/dL is technically normal. So is 72 mg/dL. Those two people are not in the same metabolic situation. The most useful frame for any result is where you fall within the range, whether it has been trending in a consistent direction over time, and how it fits with your symptoms and lifestyle.
Complete Blood Count (CBC)
The CBC measures the cellular components of blood across several systems simultaneously.
Red blood cells and hemoglobin reflect oxygen-carrying capacity. Low hemoglobin points to anemia from iron deficiency, B12 or folate deficiency, chronic disease, or blood loss. High hemoglobin may indicate dehydration or polycythemia.
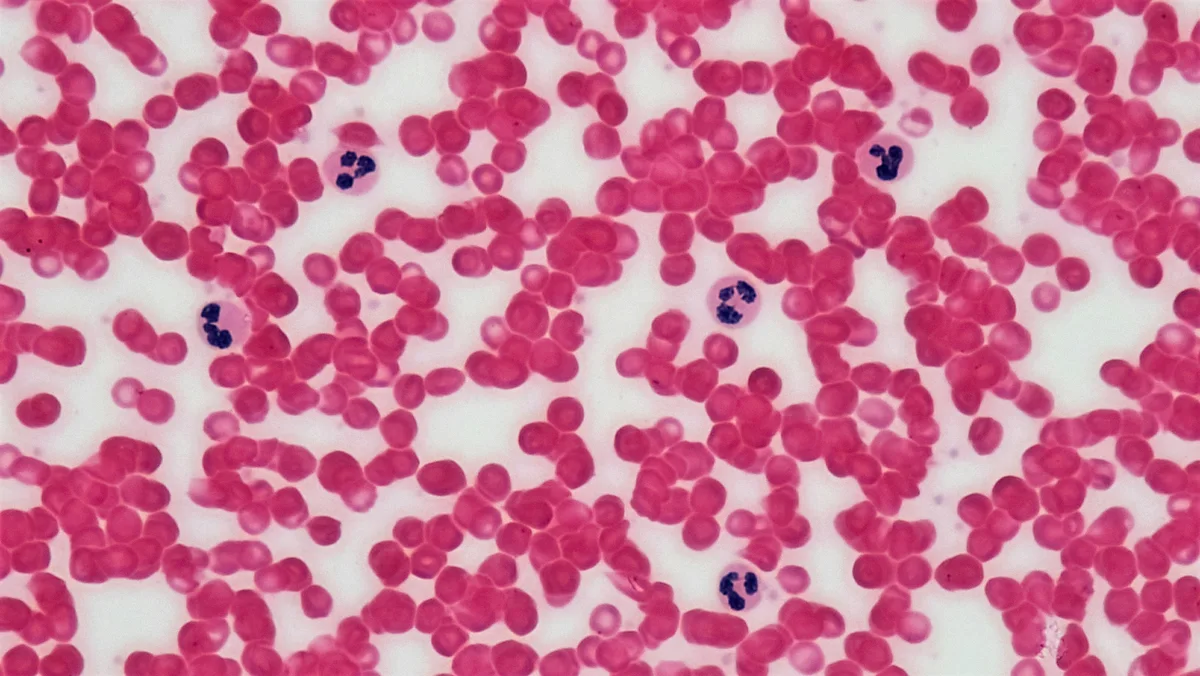
White blood cells reflect immune activity. Elevated counts suggest infection or inflammation; chronically low counts may indicate immunosuppression or bone marrow issues.
Neutrophils are the primary first responders to bacterial infection. In research published in the Journal of Cellular Biochemistry, we showed that the neutrophil’s multi-lobed nucleus, far from being a structural curiosity, actively contributes to how these cells migrate through tissue and engage pathogens.
Platelets regulate clotting. Very low platelets increase bleeding risk; very high counts increase clotting risk.
References:
- Carvalho LO, Aquino EN, Neves ACD, Fontes W. (2015). The neutrophil nucleus and its role in neutrophilic function. Journal of Cellular Biochemistry, 116(7), 1316-1322. PubMed
Metabolic Panel: Blood Glucose and Insulin
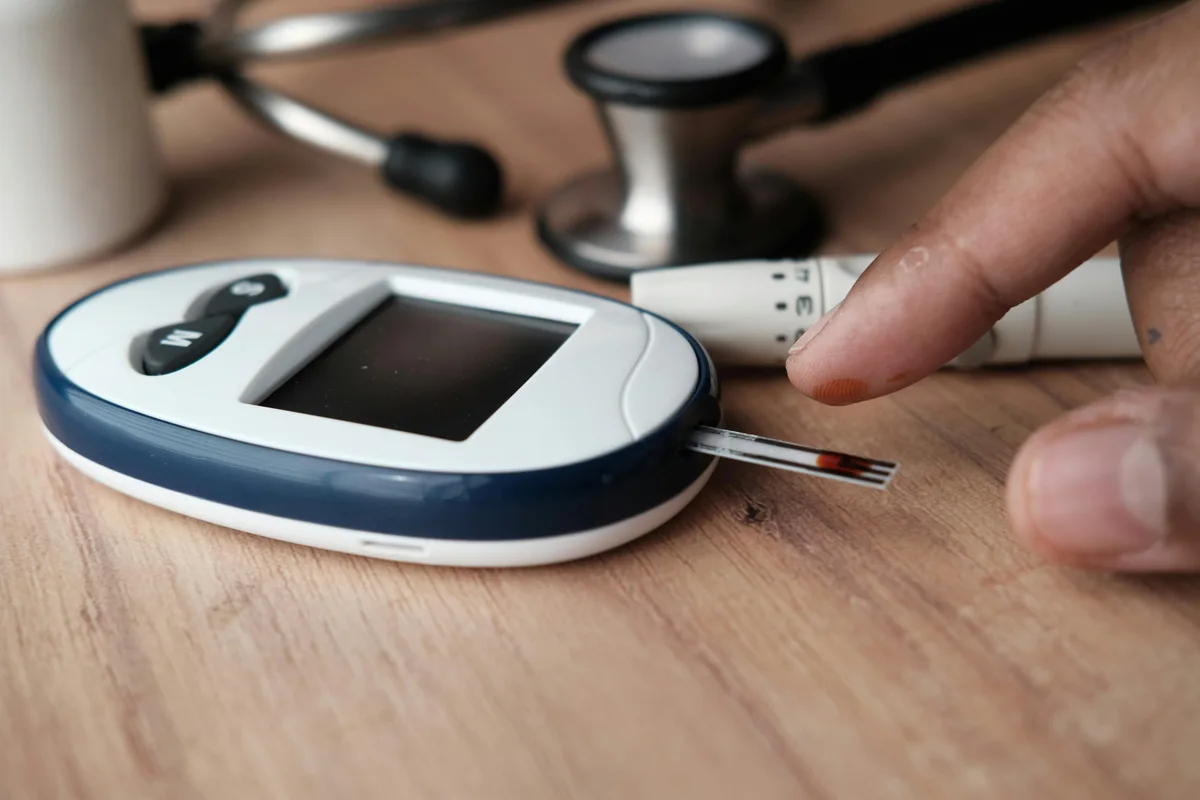
Fasting glucose below 100 mg/dL is considered normal, with pre-diabetes defined as 100 to 125 mg/dL. Tracking trends over time is more valuable than any single result: a value rising from 78 to 95 mg/dL over three years deserves attention even though both are technically normal.
HbA1c reflects average blood glucose over the preceding 2 to 3 months, making it a more reliable long-term marker than fasting glucose alone.
Fasting insulin is not routinely ordered but is clinically important. Normal fasting glucose with elevated fasting insulin reveals insulin resistance before it becomes visible in glucose readings. This is one of the most actionable patterns a preventive panel can identify.
References:
- American Diabetes Association. (2023). Standards of Medical Care in Diabetes. Diabetes Care, 46(Suppl 1). PubMed
🌿 Fasting glucose trending upward? Berberine HCl activates AMPK, the same cellular energy sensor targeted by metformin, to improve insulin sensitivity and support healthy glucose regulation.
Check Berberine HCl on Amazon →Lipid Panel

LDL is more nuanced than the “bad cholesterol” label suggests. LDL particle size and number are more predictive of cardiovascular risk than total LDL concentration alone. Small, dense particles are significantly more atherogenic than large, buoyant ones at equivalent concentrations.
HDL facilitates reverse cholesterol transport. Higher is generally protective, though very high HDL without other healthy markers may not confer the expected benefit.
Triglycerides respond rapidly to dietary changes, making them a useful short-term indicator of metabolic improvement. They also rise with insulin resistance, metabolic syndrome, and cardiovascular risk.
The TG/HDL ratio is a practical surrogate for insulin resistance that requires no additional testing beyond the standard panel.
References:
- Grundy SM, Stone NJ, et al. (2018). 2018 AHA/ACC guideline on the management of blood cholesterol. Journal of the American College of Cardiology, 73(24), e285-e350. PubMed
Liver Function Tests
ALT and AST are enzymes released when liver cells are damaged, from causes including non-alcoholic fatty liver disease, alcohol, medications, or viral hepatitis. NAFLD is increasingly prevalent and can progress silently for years. ALT is more liver-specific than AST: an elevated AST with normal ALT may reflect muscle or cardiac sources rather than hepatic injury.
References:
- Khan RS, et al. (2019). Modulation of insulin resistance in nonalcoholic fatty liver disease. Hepatology, 70(2), 711-724. PubMed
Thyroid Function
TSH is the primary screening test. It rises in hypothyroidism and falls in hyperthyroidism. Hypothyroidism is significantly more common in women and frequently presents with fatigue, weight gain, cold intolerance, and hair thinning, symptoms easy to attribute to other causes. Unexplained fatigue that does not improve with adequate sleep is a reason to check TSH.
Free T4 and free T3 add important information when TSH is borderline or when symptoms persist despite a TSH within range. Subclinical hypothyroidism with low-normal free T3 is a clinically relevant pattern that TSH alone can miss.
References:
- Jonklaas J, et al. (2014). Guidelines for the treatment of hypothyroidism. Thyroid, 24(12), 1670-1751. PubMed
Vitamin D

Vitamin D functions more like a hormone than a vitamin, with receptors on virtually every cell in the body regulating immune function, calcium metabolism, gene expression, and inflammatory pathways. Deficiency affects an estimated 1 billion people globally yet remains undertested in routine evaluations.
The 25-hydroxyvitamin D test is the appropriate screening marker. Levels below 30 ng/mL are considered insufficient, with optimal function more consistently associated with 40 to 60 ng/mL.
References:
- Holick MF. (2007). Vitamin D deficiency. New England Journal of Medicine, 357(3), 266-281. PubMed
- Forrest KYZ, Stuhldreher WL. (2011). Prevalence and correlates of vitamin D deficiency in US adults. Nutrition Research, 31(1), 48-54. PubMed
☀️ Vitamin D3 works best paired with K2. K2 directs calcium to bones and away from arteries, which matters when supplementing D3 at meaningful doses.
Check Vitamin D3+K2 on Amazon →Inflammatory Markers: High-Sensitivity CRP

hs-CRP detects low levels of chronic inflammation associated with cardiovascular risk. It is one of the few inflammatory markers prospectively validated as an independent predictor of cardiovascular events. Chronic low-grade inflammation is a central mechanism in cardiovascular disease, type 2 diabetes, certain cancers, and neurodegeneration. Regular exercise, quality sleep, stress management, and a diet low in ultra-processed foods all independently lower hs-CRP over time.
References:
- Ridker PM, et al. (2000). C-reactive protein and other markers of inflammation in the prediction of cardiovascular disease in women. New England Journal of Medicine, 342(12), 836-843. PubMed
💊 Chronic stress and poor sleep deplete magnesium, essential for nervous system regulation, inflammation control, and muscle recovery. Magnesium Glycinate is among the most bioavailable forms.
Check Magnesium on Amazon →Kidney Function: Creatinine and eGFR
The kidneys filter approximately 200 liters of blood per day and decline silently. Chronic kidney disease affects an estimated 10% of the global population and produces no symptoms until significant damage has occurred.
Creatinine reflects kidney filtration but depends heavily on muscle mass, age, and sex, which makes it a poor standalone marker. eGFR corrects for these variables using the 2021 CKD-EPI equation and is the standard clinical measure of kidney function.

Urine albumin-to-creatinine ratio (uACR) detects glomerular damage years before eGFR begins to fall. Levels above 30 mg/g warrant attention. Together, eGFR and uACR give a far more complete picture than either alone. BUN adds context, particularly for distinguishing intrinsic kidney disease from pre-renal causes like dehydration.
References:
- Baumgarten M, Gehr T. (2011). Chronic kidney disease: detection and evaluation. American Family Physician, 84(10), 1138-1148. PubMed
Iron Studies: Ferritin, Serum Iron, and TIBC

A CBC identifies anemia but not its cause. Iron studies fill that gap.
Ferritin is the most sensitive early marker of iron deficiency. It can fall well below functional levels before hemoglobin drops enough to meet the anemia threshold. A 2017 meta-analysis found a significant effect of iron supplementation on fatigue in non-anemic individuals with low ferritin. Laboratory lower limits are typically 12 to 20 ng/mL, but clinical evidence supports 30 to 50 ng/mL as more appropriate for excluding functional deficiency, particularly in women with persistent fatigue.
Serum iron and TIBC together give transferrin saturation (ideally 20 to 50%), which distinguishes iron deficiency anemia, anemia of chronic disease, and hemochromatosis, conditions that look similar on a CBC but require different approaches.
Vitamin B12 and folate complete the picture. B12 deficiency causes macrocytic anemia and, if prolonged, irreversible neurological damage through demyelination. It is particularly common in older adults, vegans, and long-term metformin users.
References:
- Yokoi K, Konomi A. (2017). Iron deficiency without anaemia is a potential cause of fatigue. British Journal of Nutrition, 117(10), 1422-1431. PubMed
- Al-Naseem A, et al. (2021). Iron deficiency without anaemia: a diagnosis that matters. Clinical Medicine, 21(2), 107-113. PubMed
Homocysteine: The Underordered Cardiovascular Marker

Elevated homocysteine is an independent risk factor for cardiovascular disease and stroke rarely included in standard panels. The mechanism is direct: it promotes endothelial dysfunction, oxidative stress, and a pro-thrombotic state. A meta-analysis published in JAMA in 2002 found that a 25% lower homocysteine level was associated with an 11% lower ischemic heart disease risk and a 19% lower stroke risk. A subsequent meta-analysis confirmed it as an independent predictor of cardiovascular and all-cause mortality.
Levels above 15 micromol/L are considered elevated. B12, folate, and B6 are the three cofactors that regulate clearance. Supplementation in deficient individuals consistently reduces plasma levels, though whether lowering homocysteine directly reduces clinical events remains debated.
References:
- Homocysteine Studies Collaboration. (2002). Homocysteine and risk of ischemic heart disease and stroke: a meta-analysis. JAMA, 288(16), 2015-2022. PubMed
- Peng HY, Man CF, Xu J, Fan Y. (2015). Elevated homocysteine levels and risk of cardiovascular and all-cause mortality. Journal of Zhejiang University-SCIENCE B, 16(1), 78-86. PubMed
- Refsum H, et al. (2006). The Hordaland Homocysteine Study. Journal of Nutrition, 136(6 Suppl), 1731S-1740S. PubMed
Uric Acid: More Than Gout

Uric acid is the final product of purine metabolism in humans. Its clinical significance extends well beyond gout. Elevated levels activate the renin-angiotensin system, promote oxidative stress, impair endothelial function, and cluster predictably with high triglycerides, low HDL, elevated fasting glucose, and hypertension. It is not an innocent bystander in metabolic syndrome, it is an active participant.
Levels above 7 mg/dL in men and 6 mg/dL in women are considered hyperuricemia. Primary dietary drivers are fructose from sugar-sweetened beverages, alcohol, red meat, and organ meats. In a preventive panel, elevated uric acid alongside other metabolic markers identifies a phenotype with substantially elevated cardiometabolic risk that lifestyle intervention can meaningfully modify.
References:
- Soltani Z, et al. (2013). Potential role of uric acid in metabolic syndrome, hypertension, kidney injury, and cardiovascular diseases. Current Hypertension Reports, 15(3), 175-181. PubMed
- Kanbay M, et al. (2016). Uric acid in metabolic syndrome: from an innocent bystander to a central player. European Journal of Internal Medicine, 29, 3-8. PubMed
How to Get the Most From Your Lab Results

Request a copy of your results every time. Track trends over serial measurements rather than reacting to single values. Ask not just whether a result is normal, but where it falls within the range and whether it has been moving in a consistent direction over years.
Understanding your own biology is not a privilege reserved for healthcare professionals. It is information you are entitled to use in making decisions about your health.
Have a question or a topic you would like covered? Leave a comment below or get in touch.